
Nov 16, 2026 | 652 words | 7 min read
6.2.1. ICA: Speaker Wire Resistance#
An electrical engineer has been asked to test three different types of wire to determine which will work best as inner conductors in a speaker cable. These speaker cables connect power amplifiers and speaker systems. Speaker cable wires are required to carry high levels of current. For example, an 8-ohm speaker and a 100-watt amplifier will require between 0.5 and 3 amperes using US voltages.
Since resistance limits the current flowing through the wire and therefore the amplification, the electrical engineer must analyze the different types of wire to determine which will work best in this application.
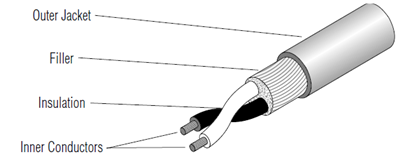
Fig. 6.1 Main Parts of a Speaker Cable#
During the test, the electrical engineer measured the resistance in ohms (\(\Omega\)) of three different wires. The three wires tested, wires 1, 2, and 3, were made from different materials and had different lengths, but all had the same cross-sectional area. The data from the tests are contained in the Excel file. The resistance of a wire (R[\(\Omega\)]) is a function of the wire dimensions (A = cross-sectional area, L = length) and material (\(\rho\) = resistivity) according to the relationship. The engineer performed the test using a 0.2 cm diameter wire.
Required Files#
Download the activity template.
Tasks#
Tests were run on three different wires to determine, by the resistance, which one is best suited for a speaker wire application. Your task is to conduct a linear regression analysis with wire length as the independent variable and measured resistance as the dependent variable to quantify the relationship between these factors across all three wire types.
In order to plot the data for all three wires on the same axis, organize the data table by the
Wire Type.Select the entire raw data table, including headers.
Go to the top ribbon and select the
Datatab.Click the
Sortbutton.In the
Sortdialog box:Check the box for “My Data has headers”
Set “Sort By” to
Wire TypeSet “Order” to
A to Z
In Table 1, use Excel built-in functions to calculate the slope, y-intercept, and R-squared value for all three data series.
Create a single scatter plot that displays all three datasets as separate data series.
Click on any completely empty cell in your worksheet (away from your data table) so no data is selected.
Go to the top ribbon and select the
Inserttab. Select a Scatter Plot with markers only. A blank, white chart box will appear. Drag it to an open area on your sheet.Right-click inside the blank chart area and click
Select Data...from the menu. TheSelect Data Sourcedialog box will open.Under
Legend Entries (Series), click theAddbutton.Configure your first data series in the Edit Series pop-up:
Series name: Type the name directly in quotation marks (e.g., “Wire 1”)
Series X values: Click inside this box, then highlight the range of cells containing the independent variable (x) data for your first series.
Series Y values: Delete any default text in this box (such as ={1} or =1), then highlight the range of cells containing the dependent variable (y) data for your first series.
Click
OKto return to the main Select Data window.Click
Addagain to open anotherEdit Serieswindow. Repeat the steps to configure the remaining data series for Wire 2 and Wire 3.
Add a linear regression trendline to each data series. Display the regression equation and the \(R^2\) value for each trendline on the plot. Confirm that the calculated slope, intercept, and \(R^2\) values match the values displayed on the scatter plot to the displayed precision.
Format the chart for professional engineering communication. Differentiate the markers by color and shape. Add a descriptive title, label both axes with units in square brackets, and include a clear legend. Make sure the legend and the trendline equations do not cover any data points.
Solutions#
View Sample Scatter Plot
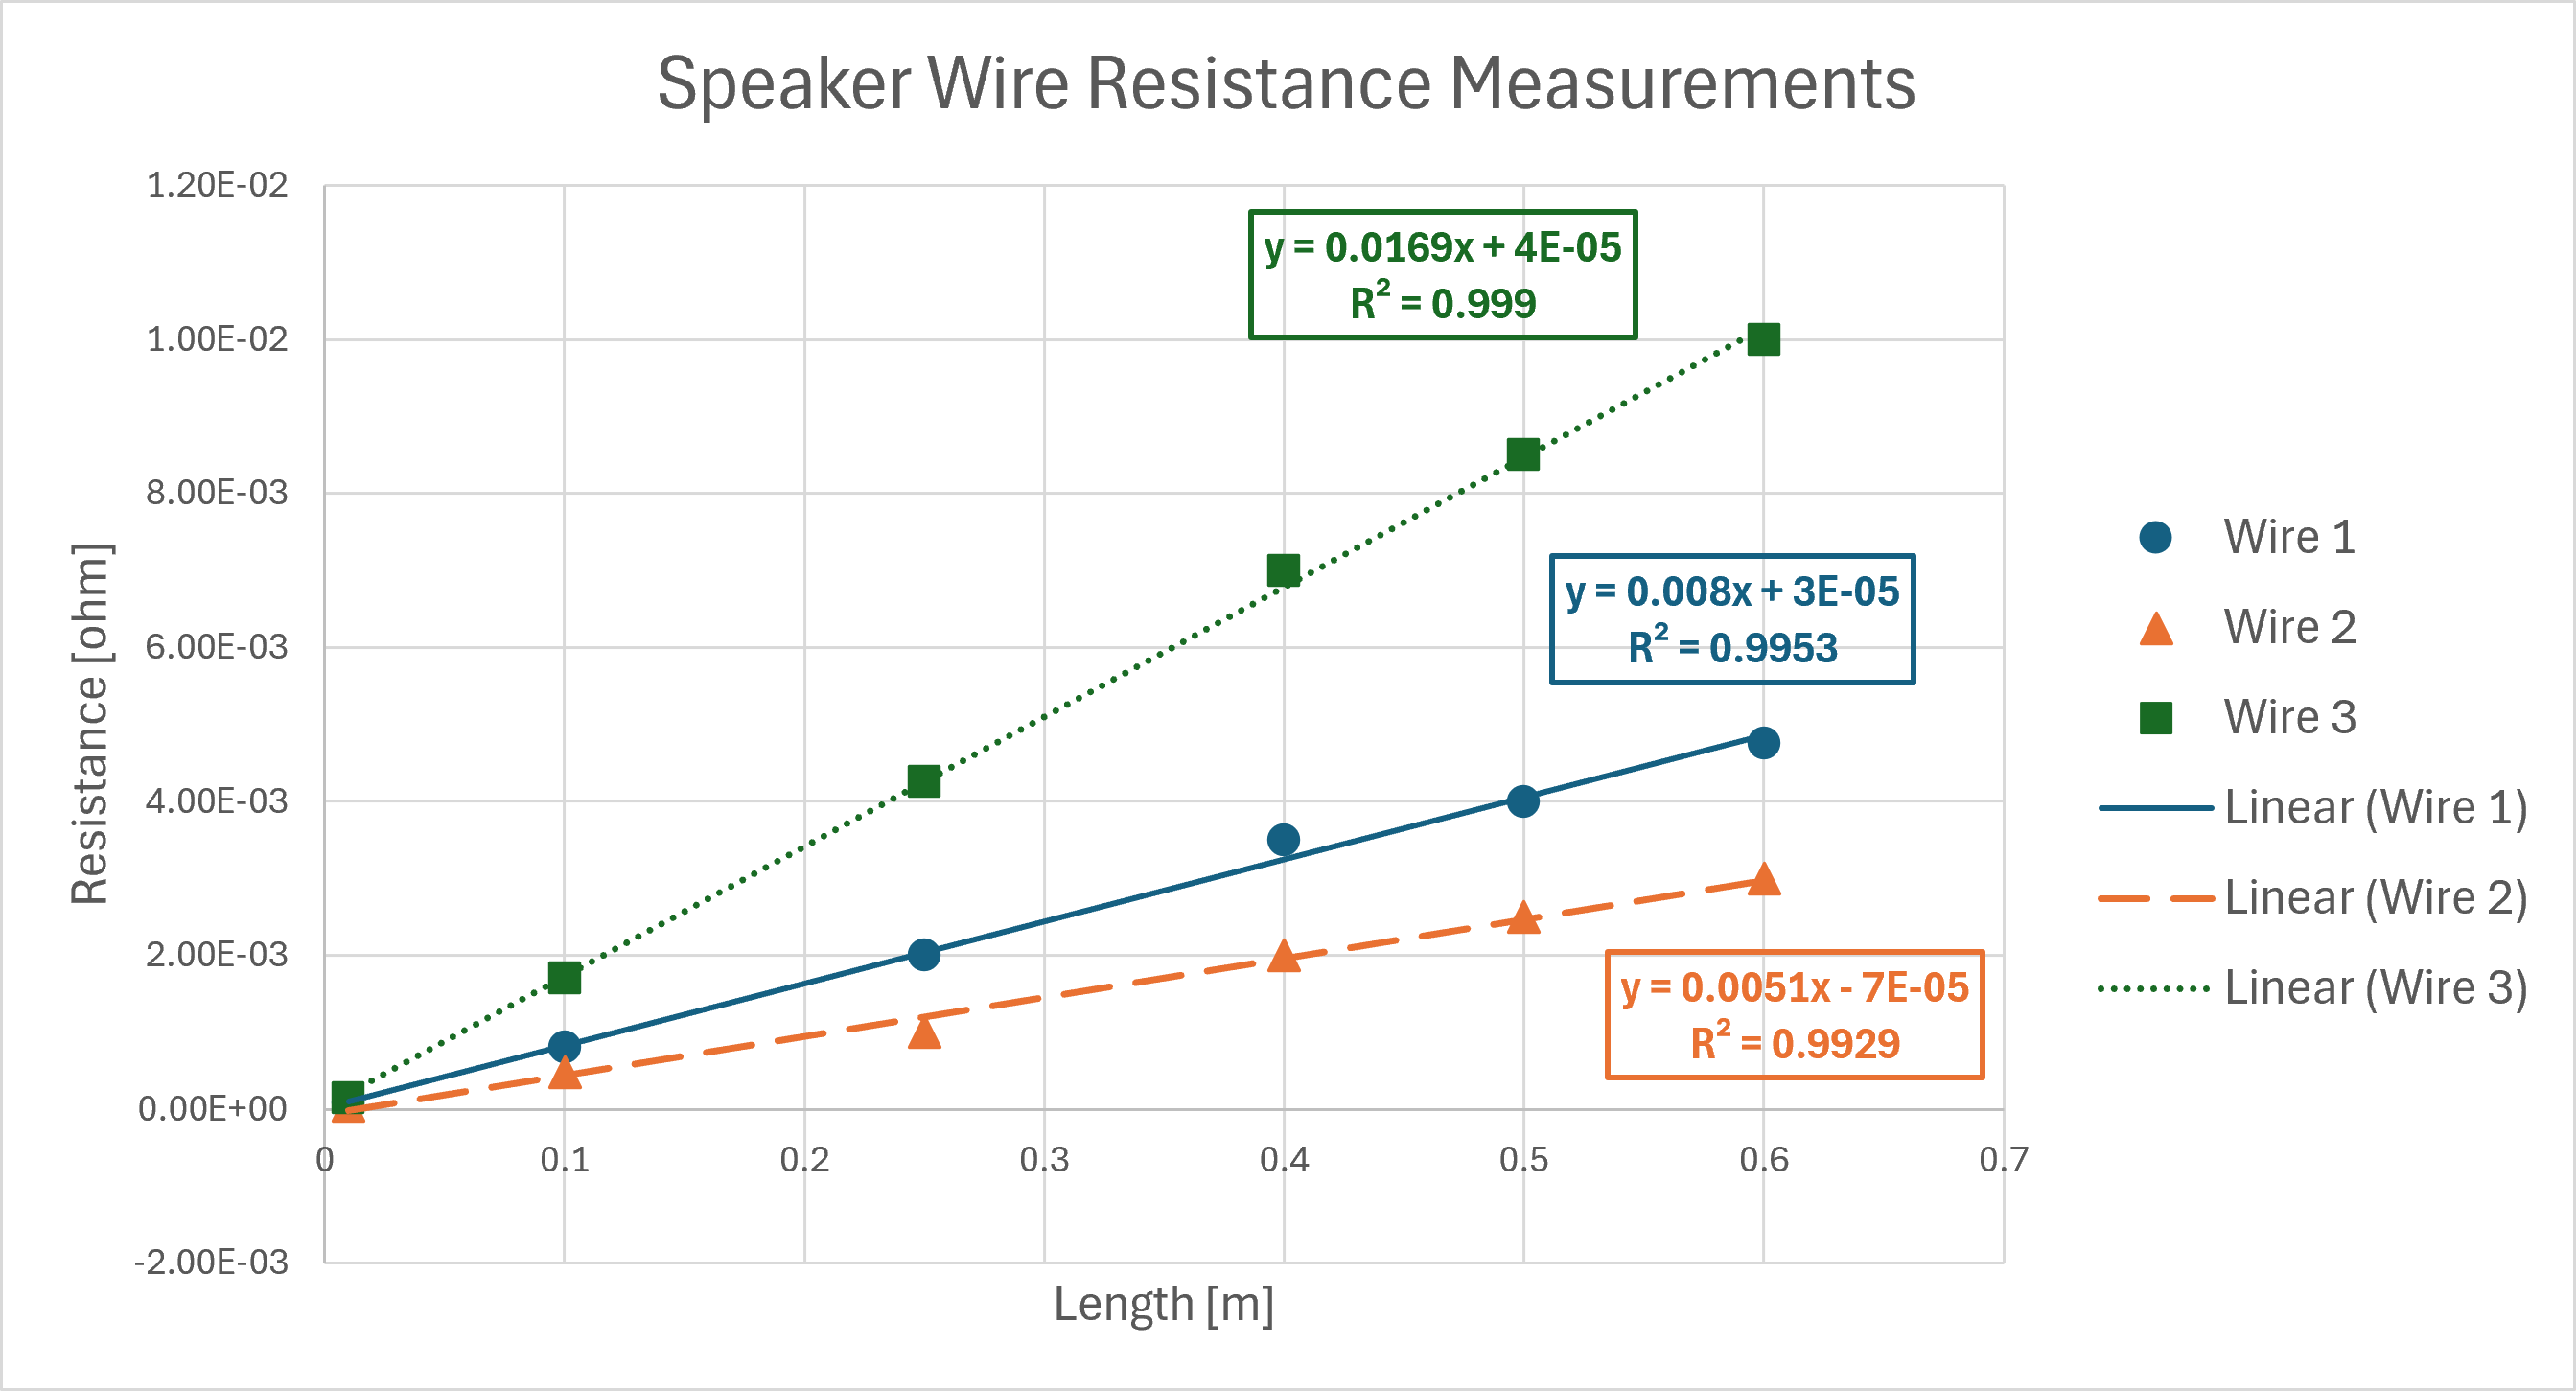
Fig. 6.2 Resistance measurements for three wire types as a function of length, demonstrating the linear relationship predicted by the resistivity formula.#
References#
Cardella, M. E., Nyquist, C. E., Ohland, M. W., & Epps, A. V. (Eds.). (2012). Ideas to innovation (3rd ed.). Pearson Learning Solutions.
Pro Co Sound. (n.d.). Main parts of a speaker cable [Digital image]. https://www.procosound.com/download/whitepapers/Understanding Speaker Cables.pdf