\[ \begin{align}\begin{aligned}\newcommand\blank{~\underline{\hspace{1.2cm}}~}\\% Bold symbols (vectors) \newcommand\bs[1]{\mathbf{#1}}\\% Differential \newcommand\dd[2][]{\mathrm{d}^{#1}{#2}} % use as \dd, \dd{x}, or \dd[2]{x}\\% Poor man's siunitx \newcommand\unit[1]{\mathrm{#1}} \newcommand\num[1]{#1} \newcommand\qty[2]{#1~\unit{#2}}\\\newcommand\per{/} \newcommand\squared{{}^2} \newcommand\cubed{{}^3} % % Scale \newcommand\milli{\unit{m}} \newcommand\centi{\unit{c}} \newcommand\kilo{\unit{k}} \newcommand\mega{\unit{M}} % % Percent \newcommand\percent{\unit{{\kern-4mu}\%}} % % Angle \newcommand\radian{\unit{rad}} \newcommand\degree{\unit{{\kern-4mu}^\circ}} % % Time \newcommand\second{\unit{s}} \newcommand\s{\second} \newcommand\minute{\unit{min}} \newcommand\hour{\unit{h}} % % Distance \newcommand\meter{\unit{m}} \newcommand\m{\meter} \newcommand\inch{\unit{in}} \newcommand\foot{\unit{ft}} % % Force \newcommand\newton{\unit{N}} \newcommand\kip{\unit{kip}} % kilopound in "freedom" units - edit made by Sri % % Mass \newcommand\gram{\unit{g}} \newcommand\g{\gram} \newcommand\kilogram{\unit{kg}} \newcommand\kg{\kilogram} \newcommand\grain{\unit{grain}} \newcommand\ounce{\unit{oz}} % % Temperature \newcommand\kelvin{\unit{K}} \newcommand\K{\kelvin} \newcommand\celsius{\unit{{}^\circ C}} \newcommand\C{\celsius} \newcommand\fahrenheit{\unit{{}^\circ F}} \newcommand\F{\fahrenheit} % % Area \newcommand\sqft{\unit{sq\,\foot}} % square foot % % Volume \newcommand\liter{\unit{L}} \newcommand\gallon{\unit{gal}} % % Frequency \newcommand\hertz{\unit{Hz}} \newcommand\rpm{\unit{rpm}} % % Voltage \newcommand\volt{\unit{V}} \newcommand\V{\volt} \newcommand\millivolt{\milli\volt} \newcommand\mV{\milli\volt} \newcommand\kilovolt{\kilo\volt} \newcommand\kV{\kilo\volt} % % Current \newcommand\ampere{\unit{A}} \newcommand\A{\ampere} \newcommand\milliampereA{\milli\ampere} \newcommand\mA{\milli\ampere} \newcommand\kiloampereA{\kilo\ampere} \newcommand\kA{\kilo\ampere} % % Resistance \newcommand\ohm{\Omega} \newcommand\milliohm{\milli\ohm} \newcommand\kiloohm{\kilo\ohm} % correct SI spelling \newcommand\kilohm{\kilo\ohm} % "American" spelling used in siunitx \newcommand\megaohm{\mega\ohm} % correct SI spelling \newcommand\megohm{\mega\ohm} % "American" spelling used in siunitx % % Capacitance \newcommand\farad{\unit{F}} \newcommand\F{\farad} \newcommand\microfarad{\micro\farad} \newcommand\muF{\micro\farad} % % Inductance \newcommand\henry{\unit{H}} \newcommand\H{\henry} \newcommand\millihenry{\milli\henry} \newcommand\mH{\milli\henry} % % Power \newcommand\watt{\unit{W}} \newcommand\W{\watt} \newcommand\milliwatt{\milli\watt} \newcommand\mW{\milli\watt} \newcommand\kilowatt{\kilo\watt} \newcommand\kW{\kilo\watt} % % Energy \newcommand\joule{\unit{J}} \newcommand\J{\joule} % % Composite units % % Torque \newcommand\ozin{\unit{\ounce}\,\unit{in}} \newcommand\newtonmeter{\unit{\newton\,\meter}} % % Pressure \newcommand\psf{\unit{psf}} % pounds per square foot \newcommand\pcf{\unit{pcf}} % pounds per cubic foot \newcommand\pascal{\unit{Pa}} \newcommand\Pa{\pascal} \newcommand\ksi{\unit{ksi}} % kilopound per square inch % NOTE: do NOT define \bar -- it is the built-in LaTeX accent used by \bar{x}, % \bar{y} (sample means). Redefining it made those render as the word "bar". \newcommand\barunit{\unit{bar}} \end{aligned}\end{align} \]

Nov 16, 2026 | 371 words | 4 min read

4.2.2. ICA: COGO Bike Share#

You are analyzing August 2019 rental data for COGO Bike Share to understand how long riders typically use the bicycles. While exploring the tripduration column, you notice some extremely large values—including trips lasting over 1,000,000 seconds (more than 11 days!). You need to mathematically identify these outliers and figure out how to accurately represent the data visually.

Required Files#

Download the activity template.

File Setup and Workbook Structure#

To follow professional engineering standards, we must always preserve our original dataset.

  • Data: This tab contains the unmodified August 2019 rental data for COGO Bike Share. Do not modify or add any calculations to this sheet.

  • Outlier Analysis: Use this separate tab to perform all descriptive statistics, outlier boundary calculations, and final chart formatting.

Excel Tip (Cross-Sheet Referencing)

To reference data from the raw sheet inside a formula on your calculations sheet, use the syntax 'SheetName'!Range.
For example: =COUNT('Data'!A2:A200)

Instructions#

Download the provided Excel spreadsheet template and complete the following tasks on the Outlier Analysis sheet.

  1. Identify Outliers: Method 1 - Interquartile Range

    • Use the =QUARTILE.INC(array,quart) function to calculate the First Quartile (Q1) and Third Quartile (Q3) of the trip durations.

    • Calculate the Interquartile Range (\(\text{IQR} = \text{Q3} - \text{Q1}\))

    • Calculate the upper outlier boundary (\(\text{Q3}+1.5 * \text{IQR}\)) and the lower outlier boundary (\(\text{Q1}-1.5 * \text{IQR}\))

  2. Identify Outliers: Method 2 - Standard Deviation

    • Use the =AVERAGE() and =STDEV.S() functions to find the mean and sample standard deviation of the trip durations.

    • Calculate the upper outlier boundary (\(\bar{x}+3\sigma\)) and the lower outlier boundary (\(\bar{x}-3\sigma\)).

      • Reminder: \(\bar{x}\) is the mean and \(\sigma\) is the standard deviation.

  3. Compare the Methods

    • Use Excel filters or =COUNTIF() to determine how many data points are flagged as outliers for either method.

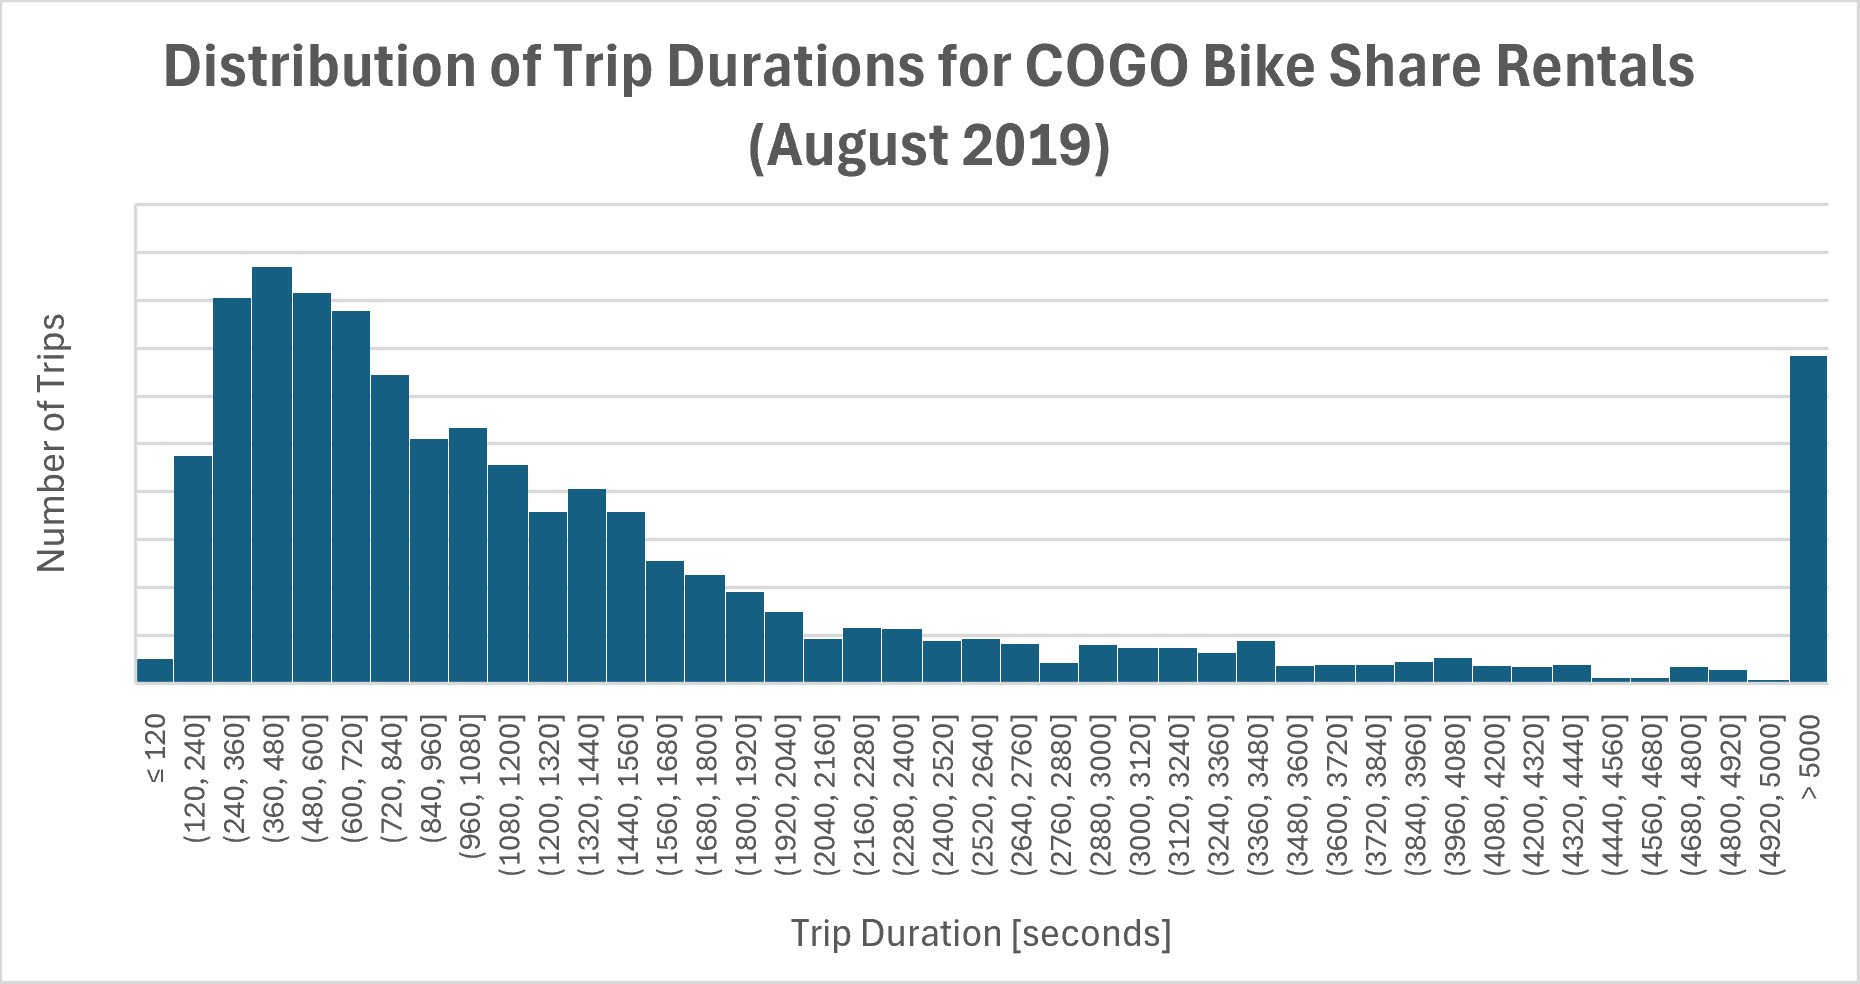
  4. Create a Final Histogram

    • Insert a histogram of the trip durations.

    • In Table 1, use formulas to calculate the number of bins (\(\sqrt{N}\)) and the starting bin width. Enter the calculated values as they are; do not round them in the table.

    • Add an underflow bin so that your bin edges start on a clean, whole number.

    • Set an overflow bin at \(> 5000\) seconds.

    • Because this dataset measures trip duration in seconds, adjust your bin width to a meaningful, whole-number time interval based on the context (e.g., 120 seconds, which represents a clean 2-minute interval).

    • Format the chart for a technical presentation: add a descriptive title, axis labels, and units.

Solution#

View Sample Histogram
Example histogram showing the distribution of trip durations for COGO Bike Share Rentals in August 2019

Fig. 4.5 Example histogram showing the distribution of trip durations for COGO Bike Share Rentals in August 2019#