
\[ \begin{align}\begin{aligned}\newcommand\blank{~\underline{\hspace{1.2cm}}~}\\% Bold symbols (vectors) \newcommand\bs[1]{\mathbf{#1}}\\% Differential \newcommand\dd[2][]{\mathrm{d}^{#1}{#2}} % use as \dd, \dd{x}, or \dd[2]{x}\\% Poor man's siunitx \newcommand\unit[1]{\mathrm{#1}} \newcommand\num[1]{#1} \newcommand\qty[2]{#1~\unit{#2}}\\\newcommand\per{/} \newcommand\squared{{}^2} \newcommand\cubed{{}^3} % % Scale \newcommand\milli{\unit{m}} \newcommand\centi{\unit{c}} \newcommand\kilo{\unit{k}} \newcommand\mega{\unit{M}} % % Percent \newcommand\percent{\unit{{\kern-4mu}\%}} % % Angle \newcommand\radian{\unit{rad}} \newcommand\degree{\unit{{\kern-4mu}^\circ}} % % Time \newcommand\second{\unit{s}} \newcommand\s{\second} \newcommand\minute{\unit{min}} \newcommand\hour{\unit{h}} % % Distance \newcommand\meter{\unit{m}} \newcommand\m{\meter} \newcommand\inch{\unit{in}} \newcommand\foot{\unit{ft}} % % Force \newcommand\newton{\unit{N}} \newcommand\kip{\unit{kip}} % kilopound in "freedom" units - edit made by Sri % % Mass \newcommand\gram{\unit{g}} \newcommand\g{\gram} \newcommand\kilogram{\unit{kg}} \newcommand\kg{\kilogram} \newcommand\grain{\unit{grain}} \newcommand\ounce{\unit{oz}} % % Temperature \newcommand\kelvin{\unit{K}} \newcommand\K{\kelvin} \newcommand\celsius{\unit{{}^\circ C}} \newcommand\C{\celsius} \newcommand\fahrenheit{\unit{{}^\circ F}} \newcommand\F{\fahrenheit} % % Area \newcommand\sqft{\unit{sq\,\foot}} % square foot % % Volume \newcommand\liter{\unit{L}} \newcommand\gallon{\unit{gal}} % % Frequency \newcommand\hertz{\unit{Hz}} \newcommand\rpm{\unit{rpm}} % % Voltage \newcommand\volt{\unit{V}} \newcommand\V{\volt} \newcommand\millivolt{\milli\volt} \newcommand\mV{\milli\volt} \newcommand\kilovolt{\kilo\volt} \newcommand\kV{\kilo\volt} % % Current \newcommand\ampere{\unit{A}} \newcommand\A{\ampere} \newcommand\milliampereA{\milli\ampere} \newcommand\mA{\milli\ampere} \newcommand\kiloampereA{\kilo\ampere} \newcommand\kA{\kilo\ampere} % % Resistance \newcommand\ohm{\Omega} \newcommand\milliohm{\milli\ohm} \newcommand\kiloohm{\kilo\ohm} % correct SI spelling \newcommand\kilohm{\kilo\ohm} % "American" spelling used in siunitx \newcommand\megaohm{\mega\ohm} % correct SI spelling \newcommand\megohm{\mega\ohm} % "American" spelling used in siunitx % % Capacitance \newcommand\farad{\unit{F}} \newcommand\F{\farad} \newcommand\microfarad{\micro\farad} \newcommand\muF{\micro\farad} % % Inductance \newcommand\henry{\unit{H}} \newcommand\H{\henry} \newcommand\millihenry{\milli\henry} \newcommand\mH{\milli\henry} % % Power \newcommand\watt{\unit{W}} \newcommand\W{\watt} \newcommand\milliwatt{\milli\watt} \newcommand\mW{\milli\watt} \newcommand\kilowatt{\kilo\watt} \newcommand\kW{\kilo\watt} % % Energy \newcommand\joule{\unit{J}} \newcommand\J{\joule} % % Composite units % % Torque \newcommand\ozin{\unit{\ounce}\,\unit{in}} \newcommand\newtonmeter{\unit{\newton\,\meter}} % % Pressure \newcommand\psf{\unit{psf}} % pounds per square foot \newcommand\pcf{\unit{pcf}} % pounds per cubic foot \newcommand\pascal{\unit{Pa}} \newcommand\Pa{\pascal} \newcommand\ksi{\unit{ksi}} % kilopound per square inch % NOTE: do NOT define \bar -- it is the built-in LaTeX accent used by \bar{x}, % \bar{y} (sample means). Redefining it made those render as the word "bar". \newcommand\barunit{\unit{bar}} \end{aligned}\end{align} \]

Nov 16, 2026 | 528 words | 5 min read

3.2.1. ICA: Tennis Ball Launcher Performance#

You are part of an engineering team that has designed three prototype tennis ball launchers, and you have run physical tests to determine which launcher best meets the project criteria. Each launcher was set to three different launch angles, and the total distance the ball traveled through the air was recorded. These experimental data are summarized in your provided spreadsheet.

Required Files#

Download the activity template.

Instructions#

Download the provided Excel spreadsheet template to complete the following tasks.

Clean the Data#

The intern who recorded this data accidentally included the text “deg” in the launch angle cells. Because of this, Excel will read the values as categorical text rather than continuous numerical data. Fix the data so it can be graphed, ensuring that units are placed exclusively in the column headings.

Visualize the Data#

Plot all three sets of launcher data (Launcher A, B, and C) on a single graph to compare their performance. The Launch Angle should be plotted on the horizontal (x) axis. Select the appropriate chart type used to visualize the correlation between two continuous numerical variables.

Hint: Plotting Multiple Sets of Data

Because the independent variables (Launch Angles) in your provided data are different for each launcher, you cannot simply highlight the entire table and insert a chart. You must explicitly separate the data into three distinct series.

This method allows your data to remain exactly as provided, keeping one variable per column.

  1. Insert a blank chart: Click an empty cell away from your data, go to the Insert tab, and insert a blank chart.

  2. Open the menu: Right-click the blank chart and click Select Data.

  3. Add Launcher 1: Click Add to create your first data series.

    • Series Name: Type “Launcher 1”

    • Series X values: Highlight the three angle cells for Launcher 1 (20, 35, and 55).

    • Series Y values: Highlight the three distance cells for Launcher 1 (5, 10, and 12).

  4. Repeat for Launchers 2 and 3: Click Add again and repeat the same process for Launcher 2, then Launcher 3.

If you prefer to organize your data before graphing, you can rebuild the table so that every launcher has its own dedicated angle and distance columns.

  1. Create staggered columns: Create a new table where the X (Angle) and Y (Distance) variables for each launcher are paired next to each other.

  2. Transfer the data: Copy and paste the corresponding data into these new columns.

  3. Insert the chart: Highlight this entire new wide-format table, go to the Insert tab, and select the chart. Excel will automatically detect the column pairings and plot them as three separate series.

Format for Technical Presentation#

Ensure your chart meets all ENGR 131 technical formatting standards.

  • Because this is measured experimental data, represent the data series using the correct engineering standard (markers only, no smooth connecting lines).

  • Change the marker colors and shapes to make it easier to differentiate between the three Launchers.

  • Add a descriptive chart title that clearly communicates the context of the data.

  • Include axis labels with proper units enclosed in brackets.

  • Include a legend to distinctly identify Launcher A, Launcher B, and Launcher C.

Solution#

View Sample Solution
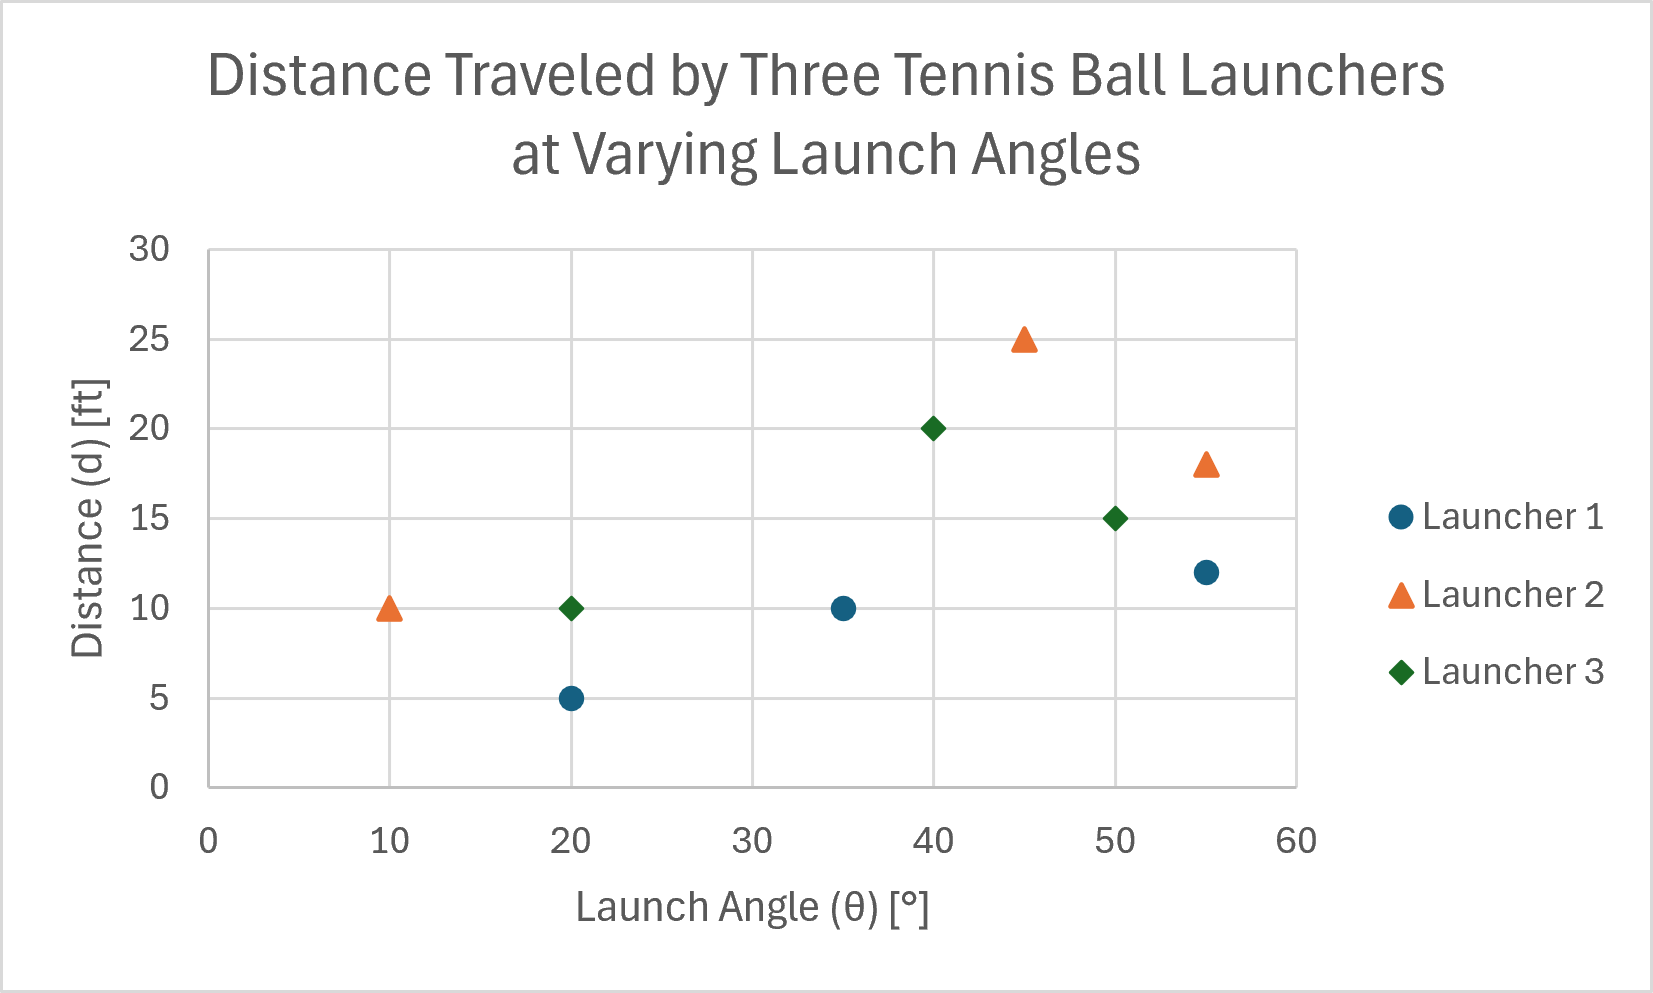
Example scatter plot showing data from all three tennis ball launchers.

Fig. 3.1 Example scatter plot showing data from all three tennis ball launchers.#