
Nov 16, 2026 | 1076 words | 11 min read
3.3.1. EX: Spreadsheet Foundations#
A structural engineering team is evaluating different steel beam designs for a new pedestrian bridge. To meet safety regulations, the engineers must ensure that the beams do not deflect (bend) beyond a specified limit under heavy foot traffic. As the lead data analyst, you will calculate the expected deflection for a prototype beam under varying load conditions. You will then choose the most appropriate charts to present this performance data to city planners.
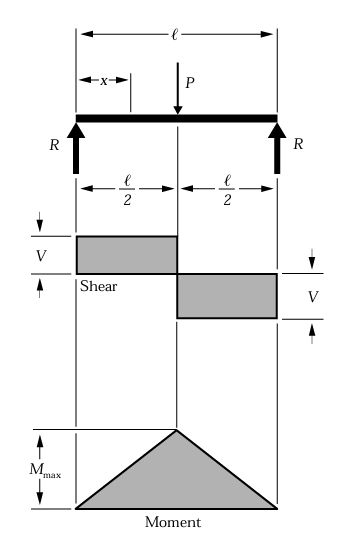
Fig. 3.2 Shear and moment diagrams for a simply supported beam subjected to a concentrated load (\(P\)) at its center (American Wood Council, 2007). Upward reaction forces \(R\) act at both ends. The shear diagram is constant and positive over the left half and constant and negative over the right half, and the moment diagram is a triangle peaking directly under the center load.#
The maximum deflection (\(\delta\), in millimeters) of a simply supported beam with a center load is calculated using the following engineering formula:
Where:
\(P\) = Applied load (Newtons, N)
\(l\) = Span length of the bending member (mm)
\(E\) = Modulus of elasticity of the material (MPa)
\(I\) = Moment of inertia (mm\(^4\))
\(V\) = Shear force (lbs)
\(M\) = Maximum bending moment (in.-lbs.)
\(R\) = Reaction load at bearing point (lbs)
\(x\) = Horizontal distance from reaction to position on the beam (in)
Reference
American Wood Council. (2007). Beam design formulas with shear and moment diagrams. American Forest & Paper Association. https://engineering.purdue.edu/~ce474/Docs/DA6-BeamFormulas.pdf
Required Files#
Download the
assignment templateand save it as 3_3_1_beam_username.xlsx. The template contains the beam data, including the dimensions and load values needed for the deflection calculations, as well as separate tabs for each task below.Download the
report template, complete it, and save it as 3_3_1_report_username.pdf. This report is where you will place your charts and answers to the analysis questions.
Quick Guide: Completing & Submitting Your Report as PDF
To complete your technical report, you must edit the provided Word template (.docx) and convert it to a PDF for final grading. Follow this simplified workflow:
Edit in Word: Download and open the
.docxtemplate in Microsoft Word. Avoid editing in web previewers or Google Docs, as they will corrupt your formulas and chart formatting.Save as PDF Only When Finished: Type your answers and copy any charts or images directly into the Word document, saving your progress frequently. Once your report is 100% complete, save or export the document as a PDF. (Do not convert to PDF early, as PDFs are static and cannot be edited!) Copy charts or images into the report and keep the originals in the workbook, since Gradescope grades the workbook.
Submit to Gradescope: Upload your finalized PDF and any other required deliverables to the corresponding assignment in Gradescope. Always review your uploaded files from the Gradescope confirmation screen to verify your work is complete.
Reminder
Rename your files with your Purdue username by replacing “template” in the filename. Then fill out any required information in the template, such as your name, email, and course details.
Task 1: Order of Operations and Data Calculations#
Navigate to the Beam Data tab in your template and complete the following calculations:
Calculate the Area Moment of Inertia (\(I\)): The beam has a rectangular cross-section. In the designated cell, enter an Excel formula to calculate \(I\) using the formula \(I = \frac{b \cdot h^3}{12}\). Use absolute cell references for the base (\(b\)) and height (\(h\)) values provided in the constants table.
Calculate Deflection (\(\delta\)): In the Deflection (mm) column, write an Excel formula to calculate the deflection at each listed load (\(P\)).
Use parentheses correctly to ensure the order of operations is followed exactly (for example, by grouping the entire denominator before dividing).
Use absolute cell references for the constants (\(L\), \(E\), and \(I\)) and relative cell references for the load (\(P\)) so you can copy the formula down the entire column.
Answer all analysis questions in the Task 1 section of the report. Use complete sentences and reference specific data in your answers.
Task 2: Chart Selection and Formatting#
Choose graph types that match the characteristics of the data (for example, scatter plots for continuous data and bar charts for categorical data).
Part A: Continuous Data Visualization#
Review the data table you just completed, which contains the Applied Load (N) and Deflection (mm).
Select the most appropriate chart type to display how deflection changes as the weight load increases.
Generate the chart in Excel and format it for technical presentation by including a descriptive title, axis labels, and units.
Part B: Categorical Data Visualization#
Navigate to the Material Analysis tab, which lists the maximum deflection limits for four different structural materials (categorical data: Steel, Aluminum, Wood, and Concrete).
Select the most appropriate chart type to visually compare the deflection limits across these distinct categories.
Generate the chart in Excel and format it for a technical presentation by including a descriptive title, axis labels, and units.
Copy your two formatted charts into the Task 2 section of the report. Keep the original charts in the workbook, since Gradescope grades the chart in the workbook, not the copy in the report. Then answer all analysis questions in that section. Use complete sentences and reference specific data in your answers.
Gradescope Submission#
Save Deliverables: Ensure all required assignment files are saved and named exactly as specified in the assignment instructions. If a template file name contains the word
template, replace only that word with your Purdue username. When a task lists more than one deliverable, such as a workbook and a report, submit each deliverable to its own matching Gradescope assignment instead of combining them into one upload.Navigate to Gradescope: Log in to Gradescope. From your Dashboard, open the assignment.
Upload your work: Select the Upload submission method. Drag and drop all required files (or a compressed
.zipfolder) into Gradescope, and select Upload.Confirm Submission: When your upload is successful, you will see a confirmation message on your screen and receive an automated email receipt.
Add Team Members (if applicable): If this is a team assignment, add all team members to the submission. Each teammate should confirm they can see the submission in their own Gradescope account. For help, visit Gradescope’s documentation on adding team members.
Review Autograder Results: Wait a few minutes for the autograder to evaluate the relevant files. Scroll down to view any failed test cases. If you need assistance interpreting the output or errors, ask your teaching team.
Resubmit if Necessary: You can edit your files and select Resubmit as many times as you need before the assignment deadline. Only your final, active submission is graded. (Note: If you need to resubmit, you must upload all required files for the assignment again).
For a detailed walkthrough, review the official Gradescope Submission Guide.